|
Lana Gibson on turning imperfect data into useful decisions. ͏ ͏ ͏ ͏ ͏ ͏ ͏ ͏ ͏ ͏ ͏ ͏ ͏ ͏ ͏ ͏ ͏ ͏ ͏ ͏ ͏ ͏ ͏ ͏ ͏ ͏ ͏ ͏ ͏ ͏ ͏ ͏ ͏ ͏ ͏ ͏ ͏ ͏ ͏ ͏ ͏ ͏ ͏ ͏ ͏ ͏ ͏ ͏ ͏ ͏ ͏ ͏ ͏ ͏ ͏ ͏ ͏ ͏ ͏ ͏ ͏ ͏ ͏ ͏ ͏ ͏ ͏ ͏ ͏ ͏ ͏ ͏ ͏ ͏ ͏ ͏ ͏ ͏ ͏ ͏ ͏ ͏ ͏ ͏ ͏ ͏ ͏ ͏ ͏ ͏ ͏ ͏ ͏ ͏ ͏ ͏ ͏ ͏ ͏ ͏ ͏ ͏ ͏ ͏ ͏ ͏ ͏ ͏ ͏ ͏ ͏ ͏ ͏ ͏ ͏ ͏ ͏ ͏ ͏ ͏ ͏ ͏ ͏ ͏ ͏ ͏ ͏ ͏ ͏ ͏ ͏ ͏ ͏ ͏ ͏ ͏ ͏ ͏ ͏ ͏ ͏ ͏ ͏ ͏ ͏ ͏ ͏ ͏ ͏ ͏ ͏ ͏ ͏ ͏ ͏ ͏ ͏ ͏ ͏ ͏ ͏ ͏ ͏ ͏ ͏ ͏ ͏ ͏ ͏ ͏ ͏ ͏ ͏ ͏ ͏ ͏ ͏ ͏ ͏ ͏ ͏ ͏ ͏ ͏ ͏ ͏ ͏ ͏ ͏ ͏ ͏ ͏ ͏ ͏ ͏ ͏ ͏ ͏ ͏ ͏ ͏ ͏ ͏ ͏ ͏ ͏ ͏ ͏ ͏ ͏ ͏ ͏ ͏ ͏ ͏ ͏ ͏ ͏ ͏ ͏ ͏ ͏ ͏ ͏ ͏ ͏ ͏ ͏ ͏ ͏ ͏ ͏ ͏ ͏ ͏ ͏ ͏ ͏ ͏ ͏ ͏ ͏ ͏ ͏ ͏ ͏ ͏ ͏ ͏ ͏ ͏ ͏ ͏ ͏ ͏
|
Kia ora legend, It’s freaking September already. Whoa. (Or is it woah?) I’ve always liked using this time of year to start thinking seriously about the next one. It’s hard to do that in December - and you don’t want to get halfway through March before cracking into the work that will define your team’s year. So book those strategy sessions, get the whiteboards out, make a plan, and just start the process. The goal is to hit the ground running when everyone returns in late January or February - not start deciding then what the year might or should look like 💪💪💪 A very quick update on our new AI course, too. Hayden Maskell and I ran the first pilot of Skip Slop & Slap™️last week - with eight participants from a government department. It was our first chance to put all the thinking, research, and activities properly through their paces. The course is designed to do two things: help you reset and become more deliberate in your relationship with AI, but also to really re-spark the human creativity you need to make your work effective. We received some great feedback, we’re making some tweaks, and we’ll run our second trial next week with a city council before launching properly. My favourite comment came from someone who said their brain was “fizzing” after the session. If you want to be on the shortlist hit reply and I’ll add you. Cheers,
Seamus Boyer 👋
|
|
“The problem isn’t Mark Zuckerberg; it’s the idea of Mark Zuckerberg. It’s that he, and all other Zuckerbergs out there and still to come, will be able to make decisions about our collective fate with impunity.” - Jamie Susskind
|
|
Haven’t done one of these wraps for a while but I’ve been reading a lot recently. Here’s some stuff that caught my eye…
|
|
I ran the data and reporting session in my Social Media for the Public Sector course last week. As I tell participants, using data well is one of the things that separates the best from the rest in our space. Yet reporting often becomes either a tick-box exercise (gather the numbers, email them somewhere, never speak of them again) or it falls off the radar altogether because no one is asking to see it. Which is a huge missed opportunity. Done properly, reporting should be something we look forward to - a chance for us to see what changed, ask why, and decide what to do differently. It doesn’t need to be perfect either - we just have to be curious and disciplined. “If you don’t know what to measure, measure anyway. You’ll learn what to measure,” as statistician David Moore said. Which brings me to today’s interview with Lana Gibson of Lanalytics. We talk about what communications teams should measure, and why the best place to start might be a whiteboard. Enjoy. 👇👇👇
|
|
Firstly, Lana, where do you work, and what do you do? I’m the Director of Lanalytics, and we help organisations use data to improve performance, understand audience behaviour, and inform digital strategy. I’m driven to help make government digital quicker and easier to use, and I often find that organisations have ideas about their audience which don’t hold up under the light of data.
At Lanalytics, we provide digital performance dashboards, training, along with analysis and recommendation reports to help organisations focus on what works, and stop putting time and resources into things that aren’t. What is your basic philosophy around using data well? Start with your goals. Don’t just approach the data thinking, ‘I’m going to have a look,’ and then disappear down a series of rabbit holes. Your goals give you a framework through which to look at the data. I focus on the big trends and try not to get caught up in the small stuff - which is really hard. This is my philosophy, not necessarily what I always do - I still go down rabbit holes [laughs]. I like to monitor performance over time so I can see the larger picture. It’s easy to get caught up looking at individual posts, but with clients I try to take the long view. That allows us to find patterns that can actually inform the work. I also try to focus on real engagement measures rather than vanity metrics. Andy Crestodina says the most visible metrics are often the least useful ones, which I think is quite impactful.
|
|
|
|
Lana Gibson is director of Lanalytics. |
|
|
|
How precise is the data we’re working with? It isn’t exact. GA4, Search Console, Meta and other platforms all measure things in different ways, so you can’t always compare them directly. Privacy choices and cookie settings also create holes in the data, and now we have AI overviews changing how people find and consume information, but very little data showing us what is happening there. That doesn’t make the data useless. It means you should focus on movement and the bigger trends rather than treating an individual figure as absolute truth. For example, how does page popularity change month-to-month? If you compare one period with another, what has changed? If you ran a campaign, can you see a difference? Our brains aren’t particularly good at finding trends in one isolated set of numbers. The value often comes from comparison.
I’m generally not a fan of putting KPIs around our data, unless we have a real handle on them over a long period of time. What’s your view on KPIs?
I understand why senior management wants KPIs, but they often don’t reflect the messy reality. There’s an idea that we can control all this stuff. But even when you compare performance year to year, there is so much happening around it. AI overviews can transform website traffic. A spike could be caused by spam. Seasonal behaviour can change the figures. So you might be doing great work and still see a number go down. I try to provide context alongside KPIs and tell the wider story: this is how people are using and engaging with our content, this is what has changed, and this is how we are responding to create a better user experience. Sometimes a big number is useful for creating a picture for senior managers, but it isn’t necessarily useful for improving your work. Is improvement the primary purpose of data? That’s my primary use for it. The value of this work is making ordinary people’s lives easier. Data should help you understand what people need and improve what you provide. But I also have to be realistic. In the current climate, clients need to prove their value to senior leaders. Fortunately, you can often do both: show your value to senior leadership while learning how to improve your work. First, go through the data for yourselves. Then create the thing you need for senior management.
|
|
|
|
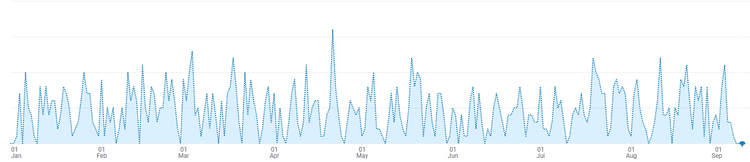
There is something almost beautiful in the stony blue peaks of a GA4 page view report. Like an icy vista at the edge of the world… |
|
|
|
What is the biggest mistake organisations make with their data? Not using it consistently over time and across the organisation.
In large organisations, you often find pockets of real expertise, but those people are doing their own thing while someone elsewhere is doing something different. The measures aren’t consistent, and there is no clear picture of overall performance.
Different measures can tell completely different stories, so you need a data strategy with clear goals - or, at the very least, an agreed and consistent view of performance.
People often think about data as a way to identify successful content and do more of it. That’s valuable, but data also lets you stop wasting time on things that aren’t working. That might be its greatest value, because none of us has enough time.
How do we build a more complete picture when attribution is becoming increasingly difficult?
Attribution has always been tricky. Someone might first find you through a paid advertisement and then return through social media. Which one gets the credit?
Now that picture is getting even more blurred. You’re never going to get a completely comprehensive view, and that should be liberating in some ways.
I encourage clients to step back and monitor overarching performance. Bring together the website, social media and other channels, but don’t stop at the front-end digital measures.
Look at your call-centre data. If people can’t find what they need on your website, they might call you instead. That is incredibly valuable user data. Look at transactions, purchases, applications and other back-end interactions. Measure those alongside website and social engagement to understand what the activity might mean.
Content, marketing and other digital teams need to work together, share data and learn from one another’s experiences. That’s how you gradually build up the picture.
Does that mean bringing all the data into one place?
Ideally, yes, but it doesn’t need to be complicated. Data Studio dashboards can be a really good way to monitor your performance. But if you don’t have the expertise or resources, I actually like numbers on a whiteboard. Choose your most important measures, put them on a whiteboard each week and see what they tell you. You won’t be able to do sophisticated analysis, but it’s a really good start while you figure out what works. People often think the tool is the problem. It isn’t, it’s the culture. Dashboards will die if people don’t communicate and talk about them.
|
|
|
|
Sometimes I like to think of the person from North Macedonia and their minute spent on my website. Who were they? What were they searching? Did they have a nice time? Are they fulfilled in life and career? I hope so. |
|
|
|
Where do you start when you go into an organisation? I start with the team. I want to understand their goals and how they think. Then, if I’m looking at a website, I focus on search: the Google searches bringing people to the site and the searches people conduct once they’re there. That tells me what people actually want from the organisation. Websites are often like vast mansions containing tens of thousands of pages. Everyone in the organisation thinks their content is important, but search data and page use show you what the website is actually being used for. I look at landing pages and traffic sources. How are people getting there? That tells you a lot about the audience and their intent. Social users are like butterflies. They’re curious, but they might not engage for long. Google users are actively seeking you out - although someone who discovers you on social media might become a Google user later. I’m cautious about big spikes, which can come from spam. For New Zealand or Australian organisations without an international audience, applying a geographic filter can help remove some of that noise. I also interrogate the long tail of the results before reaching conclusions. One page might account for 10% of all page views and make it look as though the entire website is about that subject. But when you group related pages together, another section might actually generate half the traffic. You start with the big trend, then dig into what is creating it. Is GA4 as scary as people make it out to be? Unfortunately, I think can be if you have a large website. For people who run small businesses the standard reports can be enough, but with large sites with lots of different audiences and content topics you need a bit of expertise to get useful insight. I’m comfortable using it because I’ve had a lot of time with it, but even people who were good with Universal Analytics find GA4 difficult. The same thing can be measured and labelled in several different ways. The interface is like a puzzle box, and there are holes in the data. It can be pretty impenetrable. That said, you don’t need to become a data analyst or data scientist. You mainly need time. If you have an expert in your team, getting them to create a simple dashboard can make the information much more accessible. For many people, the analytics included in Squarespace, WordPress or another platform may be perfectly adequate for a long time.
You don’t need all that complexity. Start with the key measures and go from there. Can AI help people navigate it? AI can be useful if you begin with a specific question. You might ask: “How did this campaign perform?” or “I’m seeing a drop during this campaign period - what might explain it?” Give it the relevant context and ask it to help you investigate. The AI assistant within GA4 can help you see what changed and show you where to find particular information. But you still need to sense-check its answer against the actual data. Sometimes it simply doesn’t get it. It can teach you how to find things, but you need to treat its conclusions as something to test rather than as fact. The best way to learn is through a real project. Start with something you’re currently working on and ask questions about it. Who is our audience? Why might this have happened? How could I measure this? Curiosity is the doorway into the data.
|
|
|
|
Maybe the problem is that Data Studio doesn’t have enough field options? |
|
|
|
You’ve warned against placing too much weight on likes and other engagement metrics. Is government different? Yes, meaningful engagement depends on your goals and audiences. For a commercial business, engagement might only be meaningful if someone eventually buys something. But citizens have to engage with government organisations in some form. How people feel about the police, how they perceive a council’s value, and how they experience public services affect all of us. That makes attention, engagement and sentiment more relevant for these far-reaching organisations. What does the data tell you about paid versus organic content? I’m often surprised by how poorly paid search performs once you look beyond traffic volumes. Paid activity can generate visits without meaningful engagement. With paid search, organisations can also end up paying for branded keywords - reaching people who were already searching for them and potentially cannibalising their organic traffic. I have seen paid search work well, but it takes knowledge and ongoing effort. It isn’t usually something you can simply switch on. Organic content does something different. You’re building a community around a shared interest or need, giving people useful content and developing a relationship over time. Paid promotion can’t substitute for that. The easy answer for people who don’t understand marketing or communications is often to put money behind something. But if you put the wrong content in front of the wrong people, paying for it doesn’t solve the problem. So how can a small communications or social team become more data-informed over the next six months? Start asking questions about the work you’re already doing. Choose a small number of measures and look at them consistently. You might not immediately know why something happened. But over time, you’ll begin to understand what the numbers mean - even if some of that understanding initially feels intuitive. I encourage organisations to hold monthly user-insight sessions. Bring people together to share what they’ve learnt about the audience, ask questions and discuss what they’re working on. It also helps to have a data champion, someone interested enough to bring the information together, lead the conversations and keep asking probing questions. It isn’t always your most experienced person. Junior people can be brilliant at this because they’re curious and willing to investigate. If you have a data expert elsewhere in the organisation, make friends with them. Bring them cake. That’s how I learned. Having someone you can ask questions- or who might help you create a dashboard is incredibly useful. But don’t wait for a perfect dashboard or strategy. Start small, be kind to yourself and keep looking. The more comfortable you become, the more questions you’ll begin to ask. That’s when the data starts becoming genuinely valuable.
|
Quick 6 with Lana Gibson… 1. Strategy or tactics?
In large organisations, strategy first. It’s important to get everyone on the same page and monitor performance consistently over time to reach defined goals.
2. Favourite platform? GA4 - insightful data for curious minds.
If you mean social platform … LinkedIn - helpful, and often full of humanity.
3. Least favourite platform?
GA4 - rabbit warren puzzle-box frustration. Or social platform … Instagram. Even if it has changed, I still associate it with glossy highlight reels that breed comparison. 4. One public sector account to follow?
Department of Conservation, just because I love their mahi.
5. One non-public sector account to follow?
Andy Crestodina for helpful guidance on digital marketing performance.
6. Something you wish you’d known earlier in your career?
I wish I hadn’t felt inferior to the data scientists. The work is less about getting perfect numbers, and more about translating numbers into real life improvements.
|
|
That’s it for today. Hope it’s inspired you to have a look at (or a convo about) your data today. I think in 2026 we all need to be data scientists (of a sort), so might as well jump in and have fun with it! See you again soon 👋
|

|
A media response can command hours of senior attention, while a major social channel can underperform for years without becoming an executive concern. |
|
|
|
Like what you’re reading but aren’t yet subscribed? Don’t miss out on monthly content and social media tips delivered direct to your inbox.
|
|
|
|