
How government departments are using LinkedIn
A snapshot of 400 posts from 16 federal departments
LinkedIn has changed substantially over the past few years. It is no longer simply a place for recruitment, corporate updates, and professional networking. Like most major social platforms, it now mixes information, entertainment, personal content, creators, and recommended posts.
That creates a different opportunity for government organisations, too.
To get a better idea of what government LinkedIn looks like in practice, I analysed the 25 most recent original posts from each of the 16 Australian federal government departments - 400 posts in total - collected between 28 September and 8 October 2026.
Together, the 16 accounts have a combined 1.29 million followers (not unique people).
What I found is a platform being used for a wide range of government communication. But it is also still overwhelmingly a broadcasting platform rather than a conversational one, and there are some big differences in both the way departments use LinkedIn - and the results they get from it.
A note on the method
This analysis covers the 25 most recent original posts from each of 16 Australian Government departments. Straight shares without additional commentary were excluded.
Each department therefore contributes equally to the 400-post dataset. Because departments publish at very different frequencies, however, those 25 posts cover different time periods and had different amounts of time to accumulate engagement.
All posts were manually checked and recorded. AI was used to assist with content classification and analysis, with all final content classifications manually reviewed.
There are obvious limits to what can be seen from the outside. I cannot see reach, impressions or click-throughs, and I cannot tell what contribution each department’s LinkedIn activity makes to wider organisational or strategic goals.
But that is not the purpose of this analysis.
The aim is to compare the same visible measures across departments, identify meaningful differences, and use those differences as a starting point for exploring what might be driving them.
The findings should therefore be read as a snapshot of how these 16 departments were using and performing on LinkedIn during the collection period, rather than as any kind of universal benchmark for government LinkedIn activity.
What government actually posts about
First up, I grouped the 400 posts into seven broad content categories, based on the job the content was trying to do, as follows.
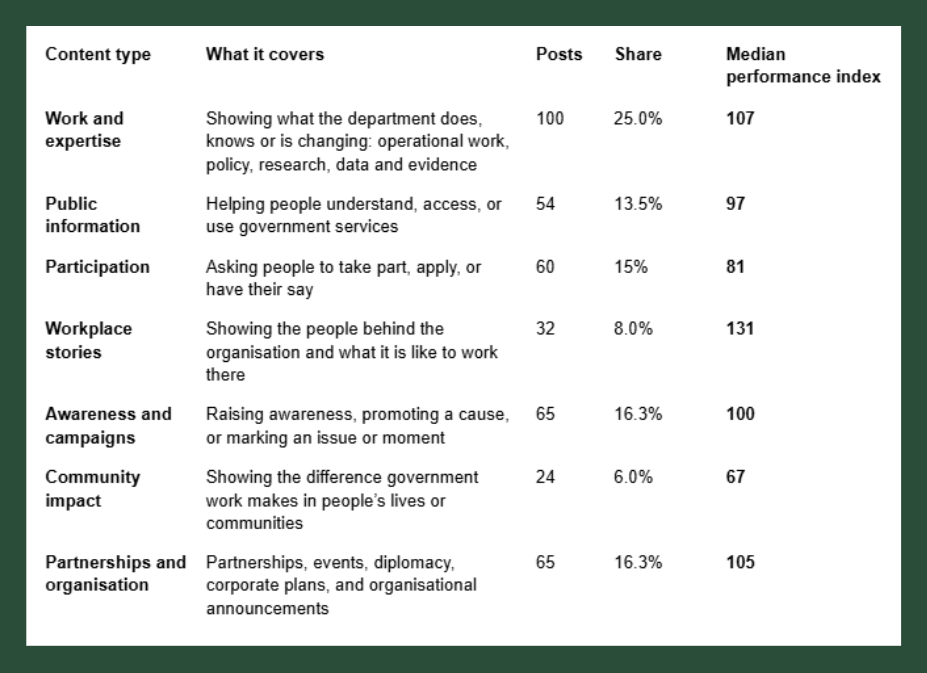
The biggest category is work and expertise, accounting for exactly a quarter of all posts, while fewer than one in 10 posts are specifically workplace stories highlighting staff or showing what it’s like to work there.
The final column - Median performance index - probably needs a little explanation.
For content analysis, I wanted to avoid a large department like Defence automatically dominating because it naturally receives more reactions than a much smaller department.
So each post was compared with the typical performance of its own department:
Performance index = ((reactions + reposts) ÷ (department median reactions + reposts)) × 100.
An index of 100 therefore means a post performed exactly in line with its department’s median. An index of 150 means it performed 50% better than normal for that department, while 50 means it achieved half the normal result.
For each content category, I then used the median index of all the posts in that category.
On that basis, workplace stories stand out clearly, with a median performance index of 131. One possible explanation is the nature of LinkedIn itself - the people featured may also be LinkedIn members, alongside their colleagues and professional networks, creating more opportunities for recognition, engagement and distribution.
Participation and community-impact content are the weakest of the seven broad categories in this sample.
Visible engagement is (very) shallow
If we randomly plot all 400 posts (minus three outliers with more than 300 reactions), the spread looks like this:
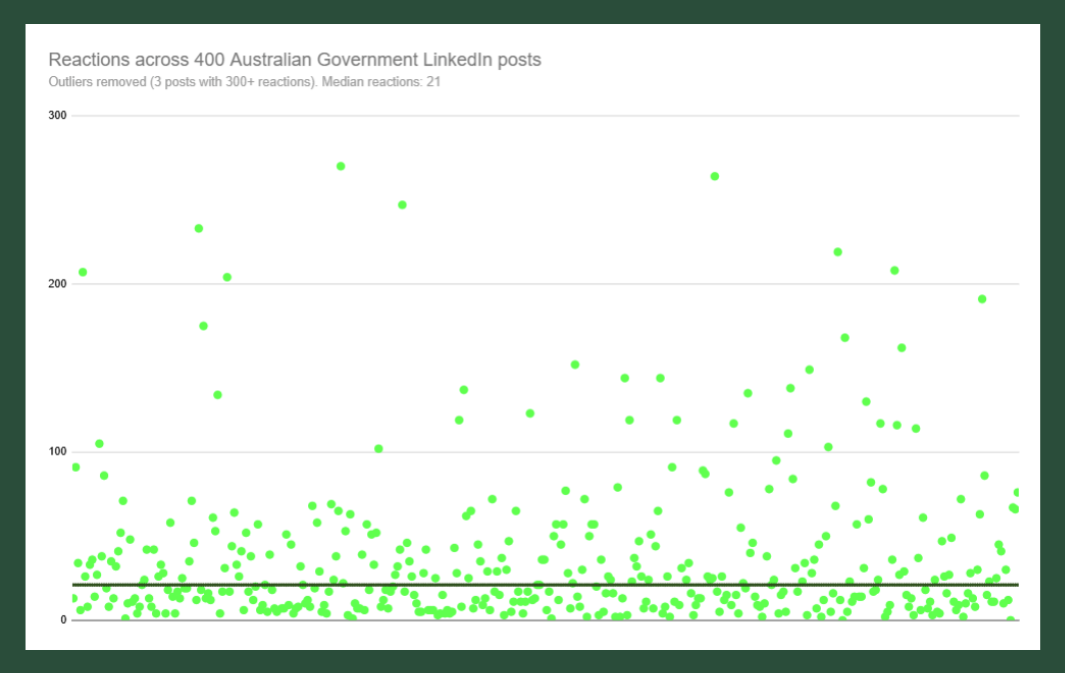
As you can see, the reaction pattern is heavily skewed - most posts sit in a relatively tight low-to-moderate range, while a small number break away and generate much stronger responses.
That matters because the standout posts are exceptions rather than the norm, and averages can therefore give a misleading picture of typical performance, which is why we use medians.
Across the total sample, the median reactions, reposts (‘shares’ on other platforms), and comments were as follows:
Across 400 posts
Median reactions = 21.5
Median reposts = 2
Median recorded comments = 1
Clearly these numbers - especially reposts and comments - are low. Which does not of course mean the posts are ineffective, but it does underline how little visible interaction the typical government post generates.
The conversation picture is weaker still.
Posts with no comments
176 / 400 (44%)
Posts with at least one recorded comment
224 / 400 (56%)
Posts with four or more comments
41 / 400 (10.3%)
Posts where the department replied to a comment
14 / 400 (3.5%)
Posts with comments turned off
29 / 400 (7.3%)
At first glance, 56% of posts receiving a comment does not sound particularly bad. But the picture is weaker when you look more closely, as 99 posts placed an external link in the comments, meaning at least some of those single comments are the department itself rather than an audience response.
A total of 176 posts had no comments at all, while another 104 had only one. Just 41 of the 400 posts attracted four or more comments.
Only 14 posts showed actual interaction between the department and somebody commenting, such as answering a question or acknowledging feedback. This is concerning.
Not every comment requires or merits a response, of course, but it is frustrating to see genuine questions left unanswered, or positive feedback about projects and staff met with nothing more than a thumbs-up - or nothing at all. These are the equivalent of free hits - opportunities to build familiarity, trust, or connection with people who have already chosen to engage. And government accounts do not get anywhere near as many of those opportunities as they would like.
Engagement can also help extend reach, with comments generally sending a stronger algorithmic signal than simple reactions.
Single image posts dominate
In terms of format, more than half of all posts are built around a single image, while another 17% use multiple images.
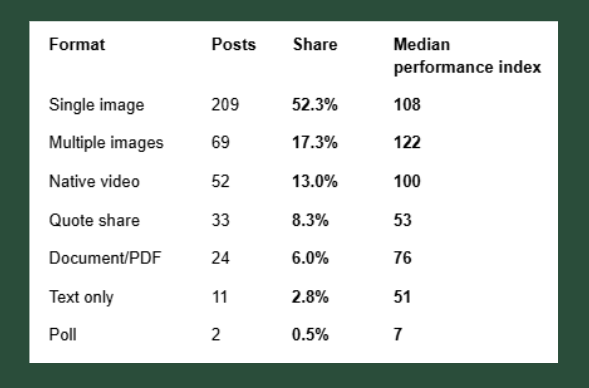
Native video accounts for just 13% of the sample. However, this figure slightly overstates the amount of genuinely video-led storytelling going on - a number of those videos were essentially animated or video versions of carousels rather than conventional filmed video.
Single and multiple-image posts perform strongly - although this may well be linked to the fact multiple-image posts often feature multiple people, for example at events, so it might be the people factor that is increasing the engagement.
The particularly poor performance of quote shares (reposts with commentary) is worth noting. They are presumably often used to support or amplify another department or partner agency, but they appear to generate relatively little engagement for the account doing the sharing. In some cases, a substantive comment on the original post may be a more natural and effective way to participate in the conversation.
People matter
Only 130 of the 400 posts - 32.5% - feature real people in the visual. The rest are a mix of graphic-based images, generic stock images, non-people imagery, and the occasional text-only post.
But when people do appear, the difference is substantial.
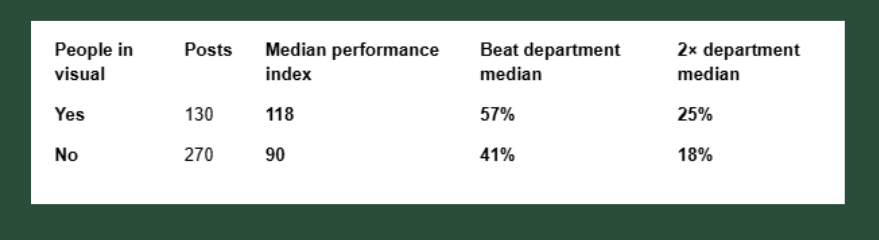
A typical post featuring people therefore performs about 18% above its department’s normal result, while a typical post without people performs about 10% below.
Importantly, this is not simply explained by people appearing more often in stronger formats. The effect remains when formats are compared separately. Multiple-image posts featuring people have a median index of 125 compared with 100 without people. Native video is 117 versus 100, while single images are 128 versus 106.
There are several plausible reasons for this. People can make institutional content feel more recognisable and human, while on LinkedIn the people featured may themselves be members of the platform, as may their colleagues and professional networks.
In short, across 400 posts and very different departments, the pattern is consistent - content featuring people is more likely to outperform the department’s usual result.
To link or not to link is no longer the question
Government LinkedIn posts are very often trying - or at least hoping - to send users somewhere else.
Of the 400 posts:
201 contained a direct external link
99 placed the link in the comments
100 contained no external link.
So around three-quarters of the posts in the sample offered to move the user away from LinkedIn to another destination.
The performance results are interesting:
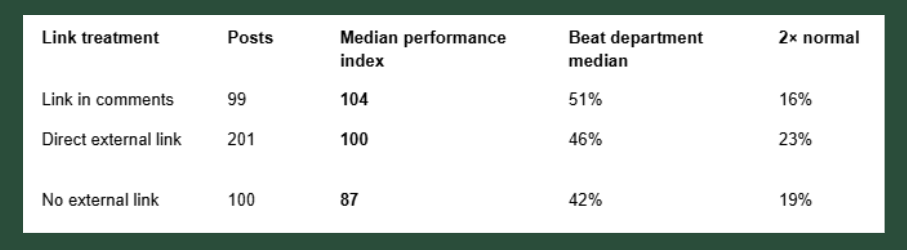
There is no convincing evidence here that placing a direct external link in a LinkedIn post materially hurts performance.
Moving the link into the comments produces a slightly higher median index - 104 versus 100 - but the difference is small. Direct-link posts are actually more likely to produce a post that performs at least twice as well as the department median.
This does not prove LinkedIn’s algorithm treats links neutrally - there are too many other differences between posts to make that causal claim.
But the data does not seem to support a simple rule that departments should routinely move links into the comments (or stop including them at all) to improve performance.
Departments are posting at very different intensities
The sample was based on each department’s 25 most recent posts, rather than posts published across a fixed time period. That revealed another big difference.
The Department of Climate Change, Energy, the Environment and Water published 25 posts in just over a week, while Infrastructure reached 25 in about two weeks.
For most departments, the sample covered roughly a month.
Finance and Treasury took around two months to publish 25 posts, while the Attorney-General’s took approximately three months.
So, some departments appear to be operating LinkedIn as an always-on publishing channel, while others are much more selective.
What does typical LinkedIn post performance look like?
Follower count is a much less direct predictor of performance than it once was, but it still matters. A department with 250,000 followers would generally be expected to attract more reactions than one with 20,000.
But the relationship is, of course, not linear.
Across the 16 departments analysed, doubling follower count was associated with only around a 50% increase in typical reactions and reposts. For a department with around 66,000 followers, the model suggests a typical post would generate around 26 reactions and reposts.
To make broad comparisons between departments with very different audience sizes, I modelled the relationship between follower count and each department’s median reactions and reposts across its 25 sampled posts. With only 16 departments, this should be treated as an indicative comparison rather than a precise benchmark.
Each department’s actual median was then compared with the modelled result for an account of its size within this group.
An index of 100 means a department’s typical post performed roughly in line with expectation. An index of 150 means its median post performed around 50% above expectation.
This is not intended as a formal benchmark or leaderboard. There are only 16 departments, and the model is sensitive to individual departments at the extremes. The indices are best used as a comparative lens for identifying accounts worth looking at more closely, rather than as precise performance scores.
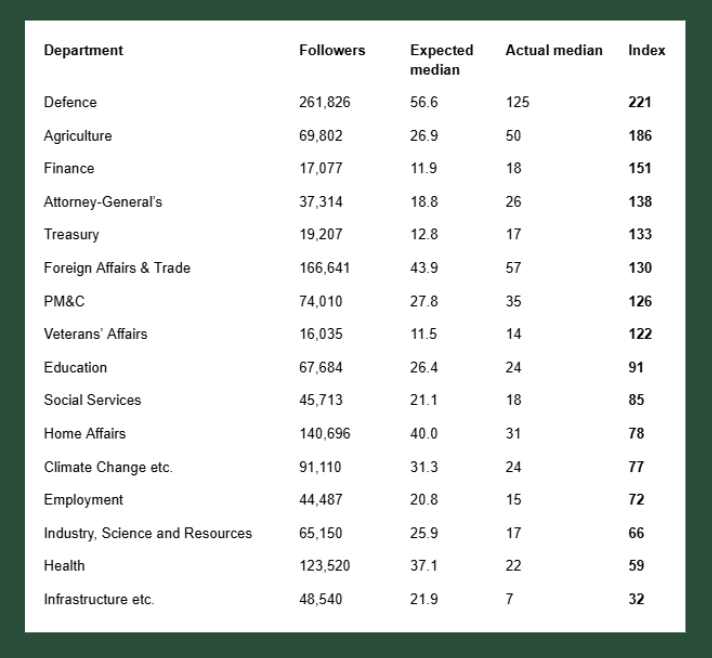
Defence is the clearest outlier at the top. Its median post attracts more than twice the reactions and reposts suggested by the model for an account of its size within this group.
There are some obvious content advantages at play here - Defence has access to strong visual material, distinctive environments, and people doing interesting things. But its feed also makes heavy use of those advantages, with the sampled posts overwhelmingly focused on showing Defence personnel actually doing their jobs, rather than relying on policy announcements, consultations, or generic corporate material.
At the other end, Infrastructure and Health sit below the modelled expectation for their audience sizes. A visual review of the feeds shows a much greater reliance on generic or stock-style imagery and fewer identifiable staff or stakeholders than some of the stronger-performing accounts.
Similar audiences, very different results
Agriculture, Education, and Industry make this difference particularly clear.
All three have between roughly 65,000 and 70,000 followers, yet their typical post performance is very different.
Agriculture’s median post generated 50 reactions and reposts, compared with 24 for Education, and 17 for Industry.
Their feeds also look and feel quite different.
Agriculture makes frequent use of people and video, and there is a strong sense of purpose around showing its work and the people doing it. Sometimes that means highly produced video, other times it is simply a collection of fairly lo-fi photos from an event or conference.
Industry’s own original content can perform well, but its feed is heavily affected by quote shares - 10 of the 25 sampled posts were reposts with commentary promoting content from other organisations.
Quote shares perform poorly across the wider dataset, and having 10 of them in a 25-post sample contributes substantially to Industry’s lower overall median.
There is also a broader channel question here, as a high proportion of reposted material changes the experience of following the account. Instead of predominantly receiving content created for that department’s audience, followers are repeatedly being served posts originating elsewhere.
A fundamentally average post
Perhaps the best way to illustrate what typical government LinkedIn looks like is simply to show what a typical post looks like.
And here it is:
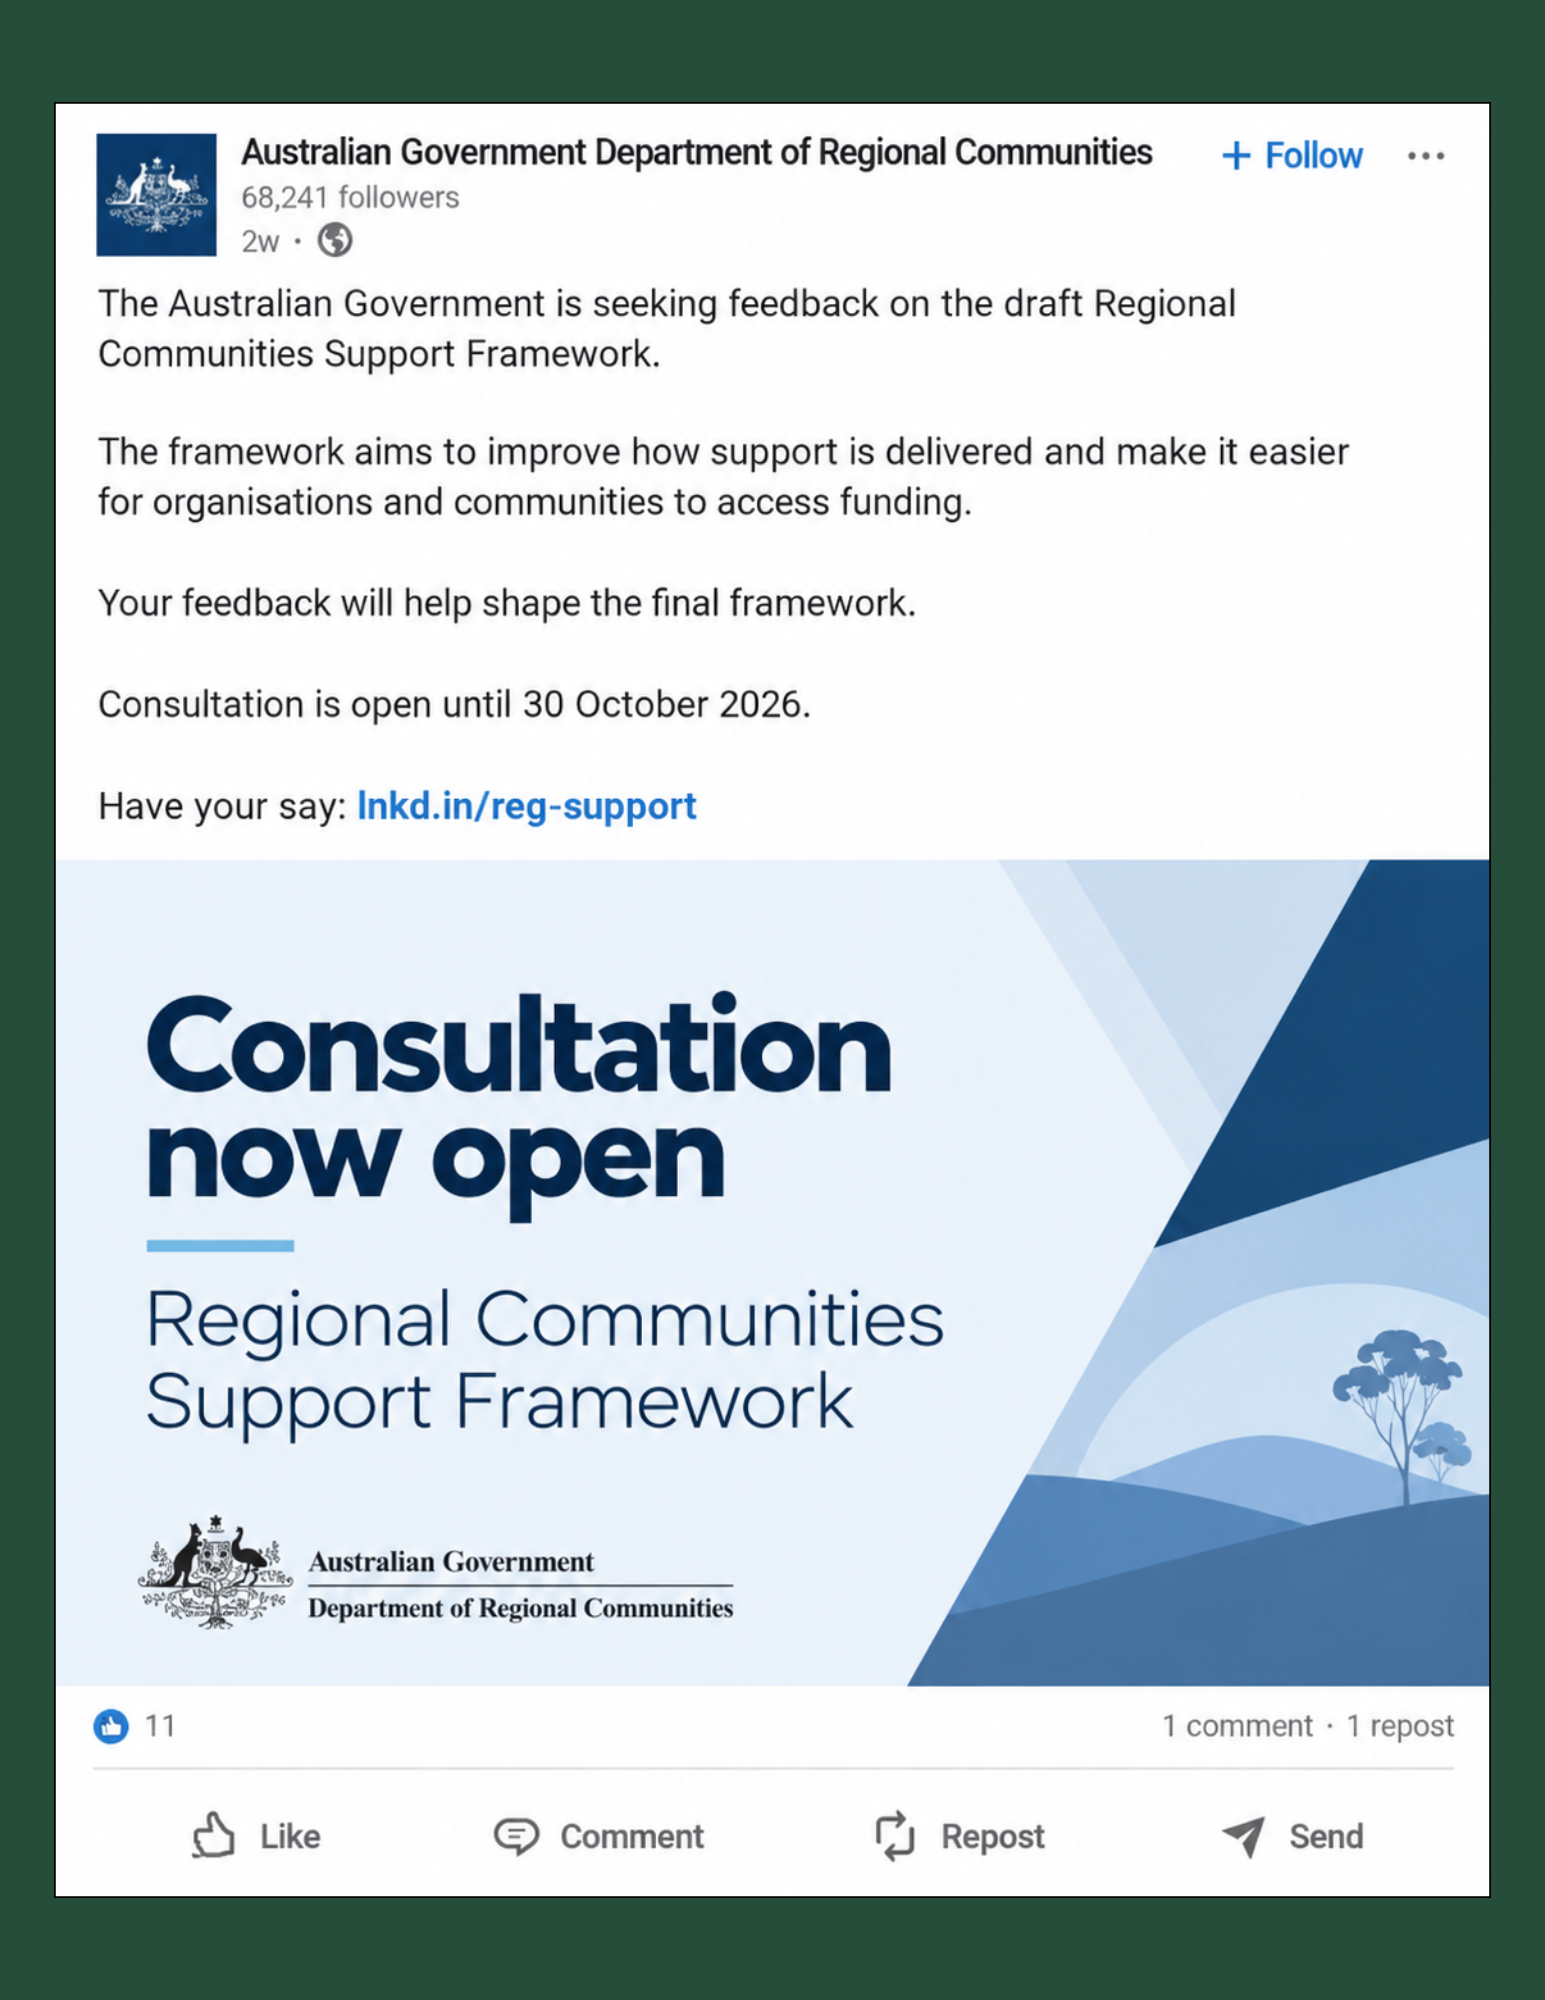
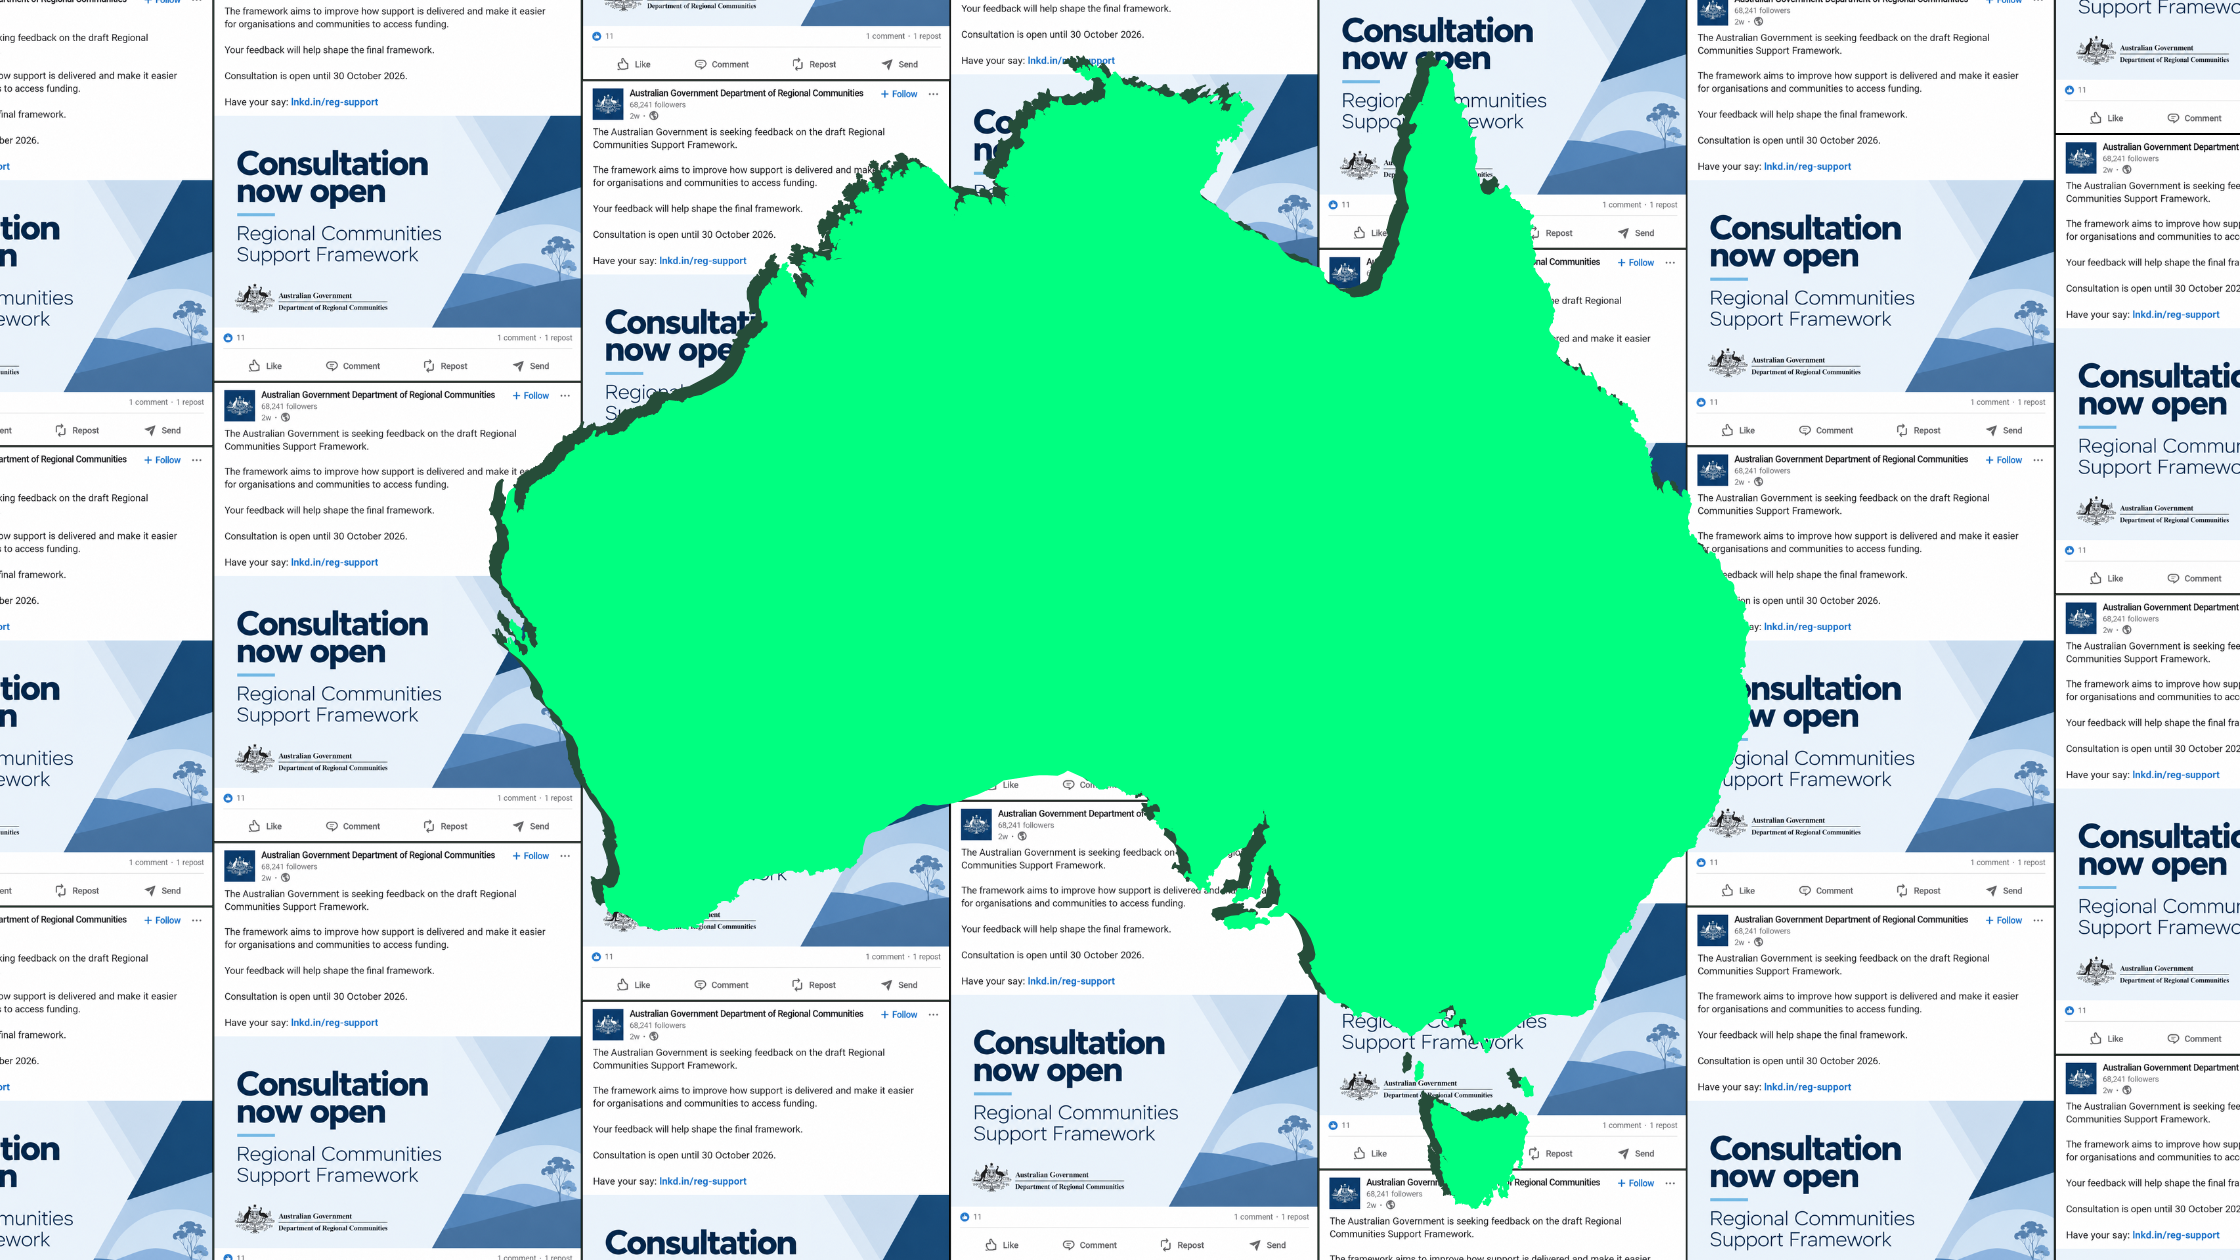
It is usually built around a branded static graphic, often carrying a large headline such as “Consultation open” or the name of an initiative, accompanied by a fairly traditional information-first caption and a link to find out more.
It is largely broadcast content, with relatively little visible engagement - around 22 reactions, a couple of reposts, and a single comment.
It is safe, controlled, and professional, but often to the point of being boring. And it is also largely faceless. Only around one-third of the 400 posts analysed featured real people in the visual.
So, what does the data suggest?
Well, quite a lot, I’d say.
The strongest message is that there are substantial differences in how departments approach the platform, and those differences appear to matter - at least in terms of driving visible engagement.
Content featuring people is consistently associated with more visible engagement.
Workplace stories are the strongest broad content category in the sample.
Original single and multiple-image posts generally perform better than quote shares, documents, or text-only content.
At the same time, some common LinkedIn assumptions look much less important. Native video does not appear to automatically be a performance winner, and putting links in comments does not show a meaningful advantage over putting them directly in the post.
And perhaps the biggest untapped opportunity is not algorithmic at all.
Government departments have built substantial audiences on a platform designed for interaction between people and organisations, yet actual conversation remains remarkably rare.
Only 14 of 400 sampled posts showed the department engaging with somebody in the comments. That is seriously low.
LinkedIn is already being treated seriously as a government publishing channel. The next step may be to treat it more seriously as a social one.
What do you reckon? Comment below or email me at seamus@seamus.nz